
Machine Learning and Online Travel Marketplaces
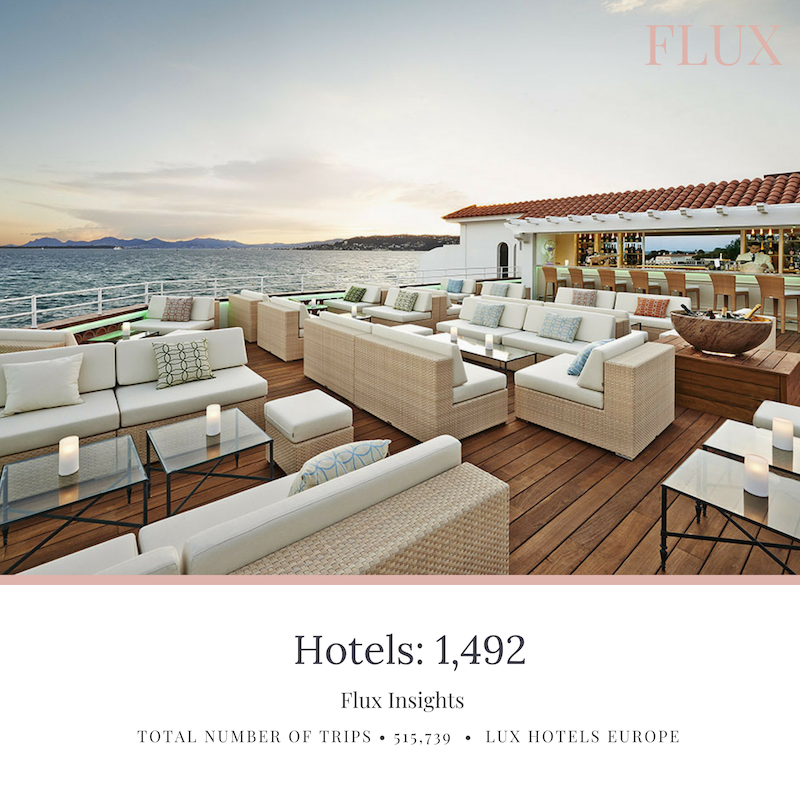
The graphs and dashboards below are a representation of data scraped from Booking.com a well-known online travel marketplace. This data-set contains 515,378 customer reviews and the scoring of 1,492 luxury hotels across Europe.
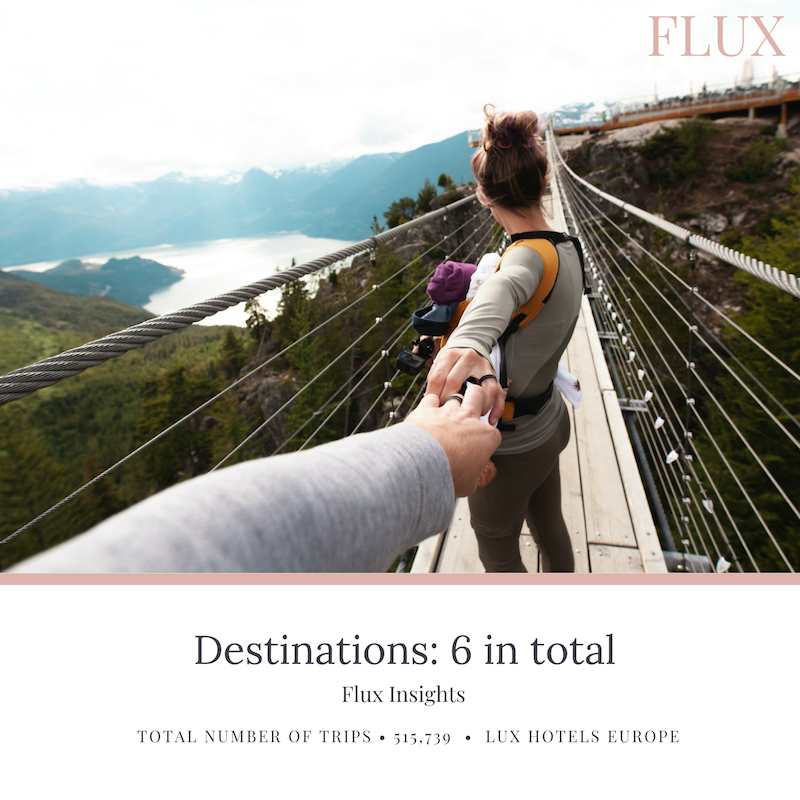
Specifically, Vienna in Austria, Barcelona in Spain, Milan in Italy, London, in the United Kingdom, Paris in France and Amsterdam in the Netherlands. Over a time-horizon of approximately 3 years from 2015 - 2017.
There are 17 primary data points used in the production of the dashboards and graphs.
However, for the benefit of space and time, and in order to provide a quick breakdown, of the number and types of travellers, and hotels. View the images below. To download the accompanying report select online travel marketplaces.


The Booking.com marketplace, comprises of 1.5 million properties. In more than, 220 countries and territories on its various websites, In over 40 languages.
Of the 1.5 million properties, 396,000 include hotels, motels and resorts. Complimented by approximately 1.1 million homes, apartments.
Travel Marketplaces the New Search Engines?
A significant amount of data is produced by the online interactions that occur within online travel marketplaces, and on the websites of partners, incumbent within their networks; hoteliers, package holiday providers, airlines, and car operators.
The tsunami of structured and unstructured data. Offers a substantial opportunity for the proprietors of luxury hotels. To leverage business intelligence to place fact-based, customer-centric, data-driven capabilities.
To validate business decisions at the fingertips of their employees. Across the most important parts of the value chain of their organisations. Customer service, sales, marketing, logistics, information technology and finance.
Leveraging Online Reviews to Drive Actionable Business Insights
Companies in the travel industry deploy machine learning tools to understand and predict a multitude of consumer behaviour.
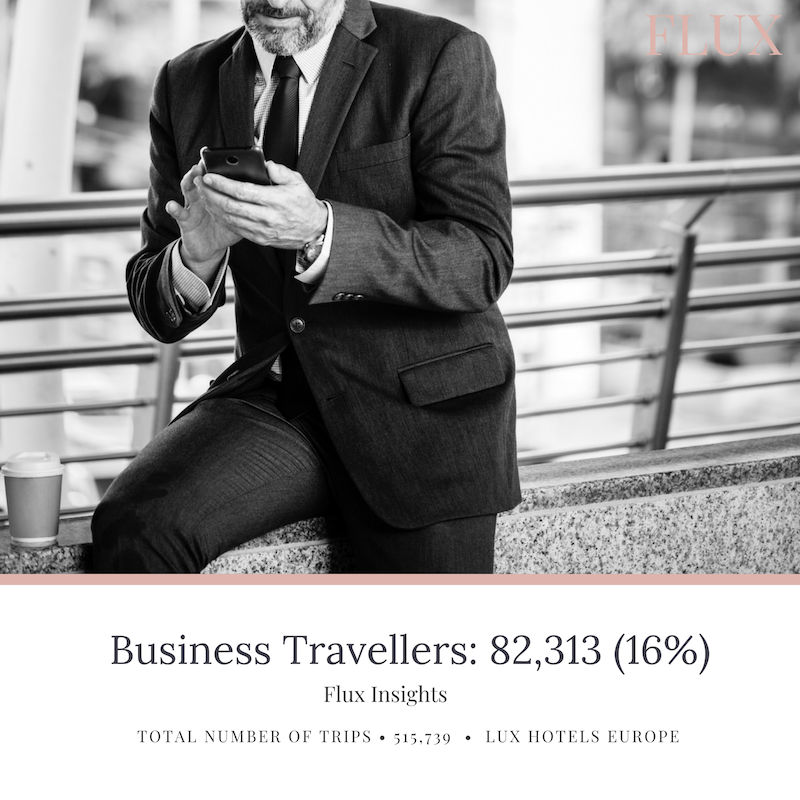
In this post, machine learning was used to measure the sentiment of 69 nationalities, that visited 1,492 luxury hotels and stayed at 2,414 unique accommodations. Across 6 European cities. Culminating in over 515,739 trips, by leisure and business travellers.
Analysis of user-generated content (UGC), may provide insights into the sentiment towards a particular hotel brand. Hence, we attempted to investigate the following;
Question 1: Are the number of positive and negative words within an online review a good predictor of positive or negative sentiment in the context of an online review submission. By a traveller that stayed at a luxury hotel?
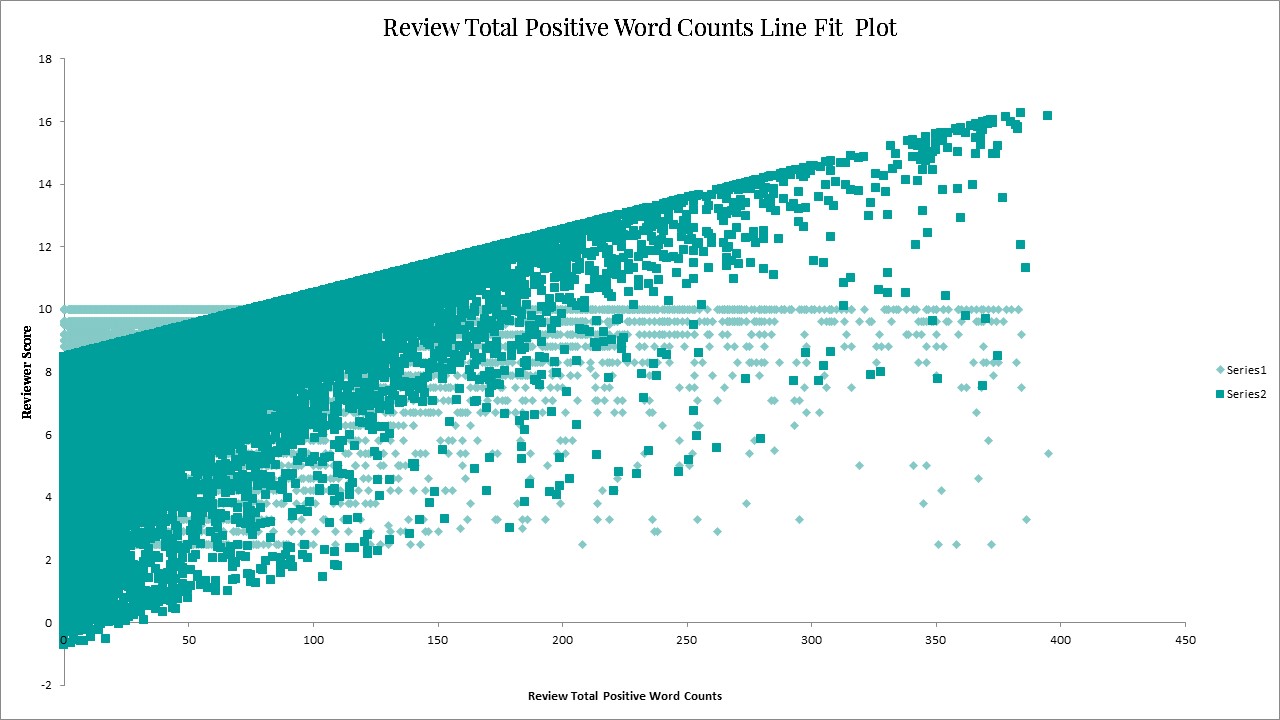
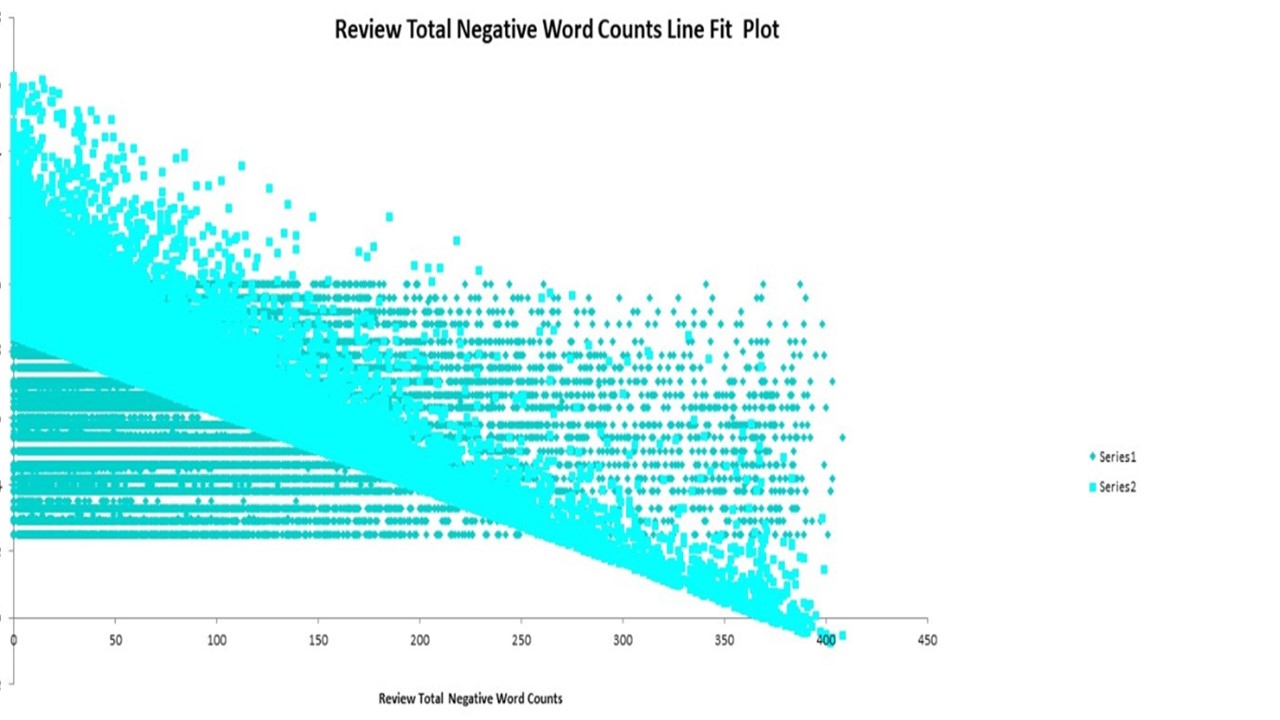
The answer is in the affirmative. The number of positive words, within an online hotel review, is a good predictor that, the hotel review submitted will be positive. Conversely, the number of negative words is an indication that the review submitted will be negative in nature.
Question 2: How much influence do the number of positive and negative words have on the overall rating of luxury hotels.
The multiple regression analysis results imply that the impact is negligible. The adjusted R squared value is 0.21 or 21%. Indicating that the number positive and negative words only accounts for 21% of the variation in the overall rating of luxury hotels.
Hence, we can conclude that other factors exert a greater degree of influence.
Although the data to verify what the other factors are, is not available in this data-set. Empirical research by the University of Wollongong. Suggests that for leisure travellers, factors that greatly influence the overall hotel rating, they submit include;

In contrast business travellers, that made hotel reservations, at five-star hotels. Are primarily concerned with the hotel location and the quality of service. Hence, in a survey of business travellers that booked hotel reservations at 5-star luxury hotels.

The Dashboard below displays, the Average Hotel Reviewer Rating Across 6 Countries in Europe.
The dashboard below provides insights into the level of sentiment, business and leisure travellers, expressed. In the reviews they submitted. Compared to the overall average hotel rating. They gave for the hotels they stayed at.
The bar chart and scatter plots provide a visual representation of the spread of the average hotel rating for luxury hotels in the 6 European countries under consideration.
At a country level and by type of traveller. Hotels in Barcelona, Spain and Vienna in Austria, as a group generated the highest overall hotel ratings. With hotels in Barcelona scoring, 8.58 out of 10 and hotels in Austria scoring, 8.56 out of 10.
Across all countries the top performing hotels were the Ritz in Paris, with an overall rating of Hotel 9.73, Hotel Casa Camper in Spain and with an overall hotel rating of 9.72 and 41 in the UK, with an overall rating of 9.71.
As you can see, there a numerous ways to interrogate this data. So I would encourage you to play around with the dashboard.
The Overall Rating of the Hotels by Travellers
The overall average hotel rating, across all the hotels and cities/countries was 8.42 over the period of 2015 – 2017. Considering all the countries scored a similar value. Implies that there is not much to differentiate between the quality of the luxury hotels. And that competition to secure hotel reservations probably is intense.
However, at a city level, there are hotels with overall hotel ratings that are significantly above or below the average country level rating.
How a 1 point increase or decrease, in the overall hotel rating, translates into an increase or decrease, sales revenue and profitability.
May require an analysis of the sales revenue and profits across the hotels. In this sample over the duration the data was collected. However, financial data was not included with this data-set.
The dashboard below, represents the total number of reviews submitted. And the total number of hotels visited, by nationality.
The dashboard below provides, insights into the number of trips made by travellers from a particular country. And the hotels they stayed at over the period the data was collected. Also, there is data on mobile or desktop submissions.
Business and leisure travellers from Denmark. Submitted 1,724 hotel reviews out of a total of 515, 215 reviews. Published by, 69 nationalities that visited, the 6 European capital cities, within this data-set.
The Danish visited a total of 760 hotels, across 6 cities, between 2015- 2017. The Dane’s gave an overall average hotel rating, of 8.33 out of 10.
Over the same period, business and leisure travellers, from South Africa. Submitted 3,821, hotel reviews on the luxury hotels, they visited across 6 cities between 2015- 2017. South Africans, gave an average overall rating of 8.42 out of 10. For the 1,045 hotels visited. Across the 6 cites.
Business and leisure travellers from the UK. Submitted 245,246 hotel reviews out of a total of 515,215 reviews. British, travellers gave an overall rating of 8.38 out of 10, for a total of 1,491 hotels. Across the 6 cities visited. Over the duration the data was collected.
Travellers from the USA. Submitted 35,437 hotel reviews. Americans, gave an overall rating of 8.54, out of 10 for a total of 1,471 hotels visited over the duration the data was collected.
As you can see, there a numerous ways to interrogate this data. So I would encourage you to play around with the dashboard.
Transactions, Interactions & Observations
One of the many roles of hoteliers, is to elicit detailed knowledge of traveller’s post trip behaviour. As this may provide an insight into their future actions.
This is quite difficult as hoteliers currently do not have a holistic view of all the activities travellers engage in. Along their customer journey prior to making a reservation and after they leave.
Also, the different type of travellers and their disparate preferences, adds an additional layer of complexity.
However, luxury travellers typically commence the search process 60 days in advance of making a reservation. This provides hoteliers with several opportunities to engage with customers at multiple points along their customer journey.
A considerable number or consumers, visit online review websites, like TripAdvisor. Social media platforms, and travel blogs prior to booking their hotel accommodation and other ancillary activities .
On some occasions, travellers have changed reservations on the basis of hotel reviews. According to (Gretzel & Yoo, 2008). Frequent travellers, value peer reviews the most and are more likely to be influenced by them.
The Personalisation Conundrum
Personalisation is a key differentiator in the luxury hotel industry. However, delivering a personalised service across all digital and physical inventory is extremely difficult.
Cracking the personalisation code. May be the next phase in achieving competitive advantage at this level. The volume, of unstructured digital data is expected to reach 35 zettabytes by 2020.
Worldwide Digital Data Created and Replicated each Year
The collection, monitoring and analysis of unstructured non-proprietary data. Such as, user-generated content, sentiment, mobile web, social media platforms, data management platforms interactions. Is necessary for the creation of a holistic view of the habits of luxury travellers.
Integrating this complimentary information with proprietary data located within CRM, ERP and SCM systems. May begin to address the personalisation challenge.
The Purveyors’ of Style over Substance?
41 in the United Kingdom, Hotel Sacher Wien, in Vienna, the Ritz Paris in France, the Excelsior Hotel Gallia Luxury Collection Hotel in Italy, the Waldorf Astoria Amsterdam, and Hotel Casa Camper in Spain.
Are examples of luxury hotels, in the later stages of the development of mature digital platforms. Capable of integrating tangible and intangible physical and digital inventory used to engage the business and leisure luxury traveller.
In a manner, which facilitates, the orchestration, of people, process, technology and data. To deliver value propositions that meet, and exceed the expectations of luxury business and leisure travellers.
To do this, requires mastering the art and science, of the seamless delivery of service excellence. Across all physical and digital channels. A significant number of hotel proprietors, in this data-set endeav0ur to do this with style. Absolutely! And substance? Always!
Data-Driven Marketers We Need You
There is a strong demand for professionals with data and analytical skills within firms. That can interpret, tell compelling stories and develop actionable business driven insights, from large data-sets.
Hence it is not surprising that there is a huge opportunity for data-driven marketers, within the travel industry and other online marketplaces, across a plethora of industry verticals.
Hal Varian, Chief Economist at Google and emeritus professor at the University of California, Berkeley. Stated the following about business intelligence and data analysis.
“So, what’s getting ubiquitous and cheap? Data. And what is complementary to data? Analysis. Take lots of courses on how to manipulate and analyse data, databases, machine learning, econometrics, statistics, and visualisation.””


